RIDE HIKE ROAM
HIKING · BIKING · TRAVEL, PLANNED ON PURPOSE
A blog for the more than average traveler, hiker, and mountain biker.
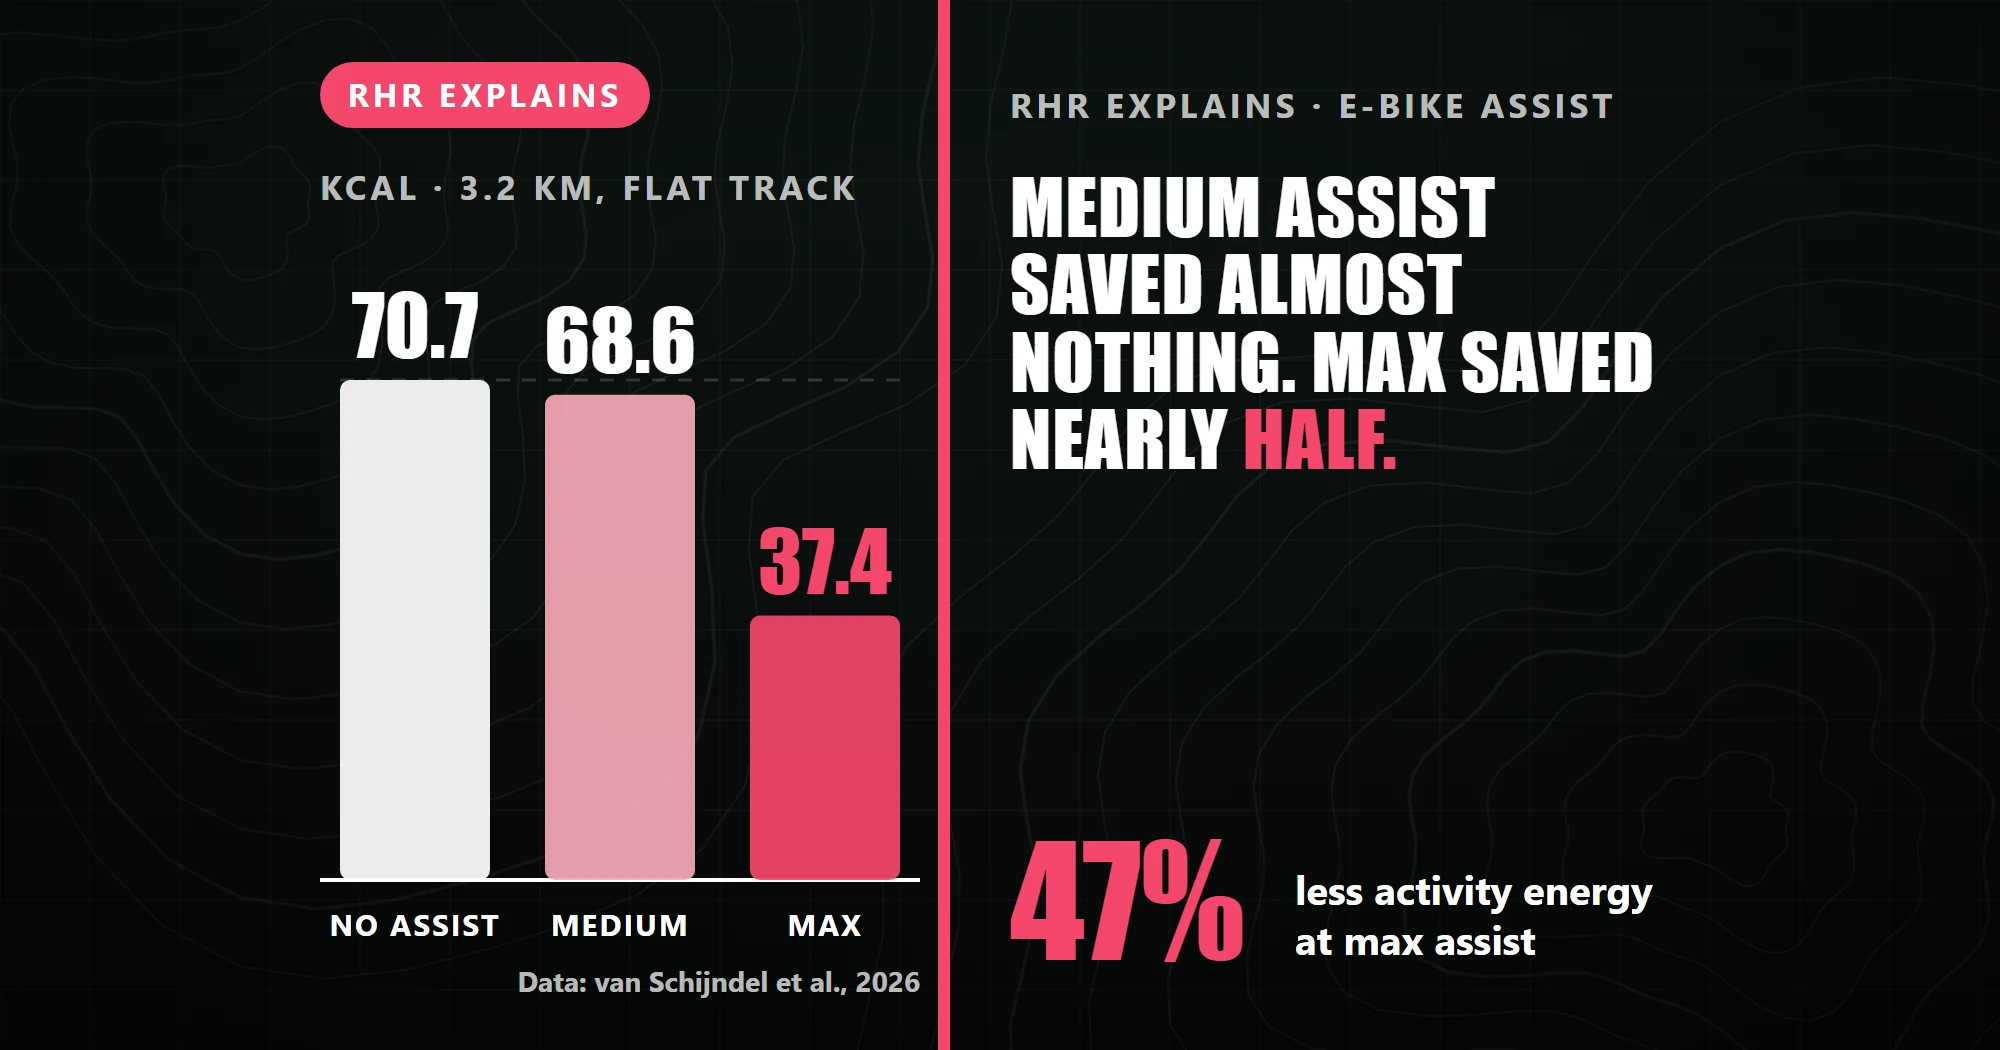
In a 2026 lab study, medium assist on an e-bike made no significant difference to the energy riders burned over a flat 3.2 kilometers. Max assist cut it nearly in half. The motor did that two ways at once: riders worked less hard, and they finished sooner.
Most people picture an e-bike motor as a discount on effort. Turn it on and some share of the work disappears. Turn it up and a bigger share disappears. Simple dial, simple math.
Researchers at HAN University of Applied Sciences in the Netherlands tested that. Ten healthy adults rode the same 3.2 kilometer loop on a flat athletics track three times, in random order: no assist, moderate assist, and maximal assist. Each rider picked a comfortable speed. The riders averaged 28 years old, and most had never ridden an e-bike before. The no-assist ride used the same e-bike with its 3 kg battery removed, not a separate regular bike. A portable analyzer measured the oxygen and carbon dioxide in their breath, so calories were calculated from each rider’s own breathing instead of looked up in a table.
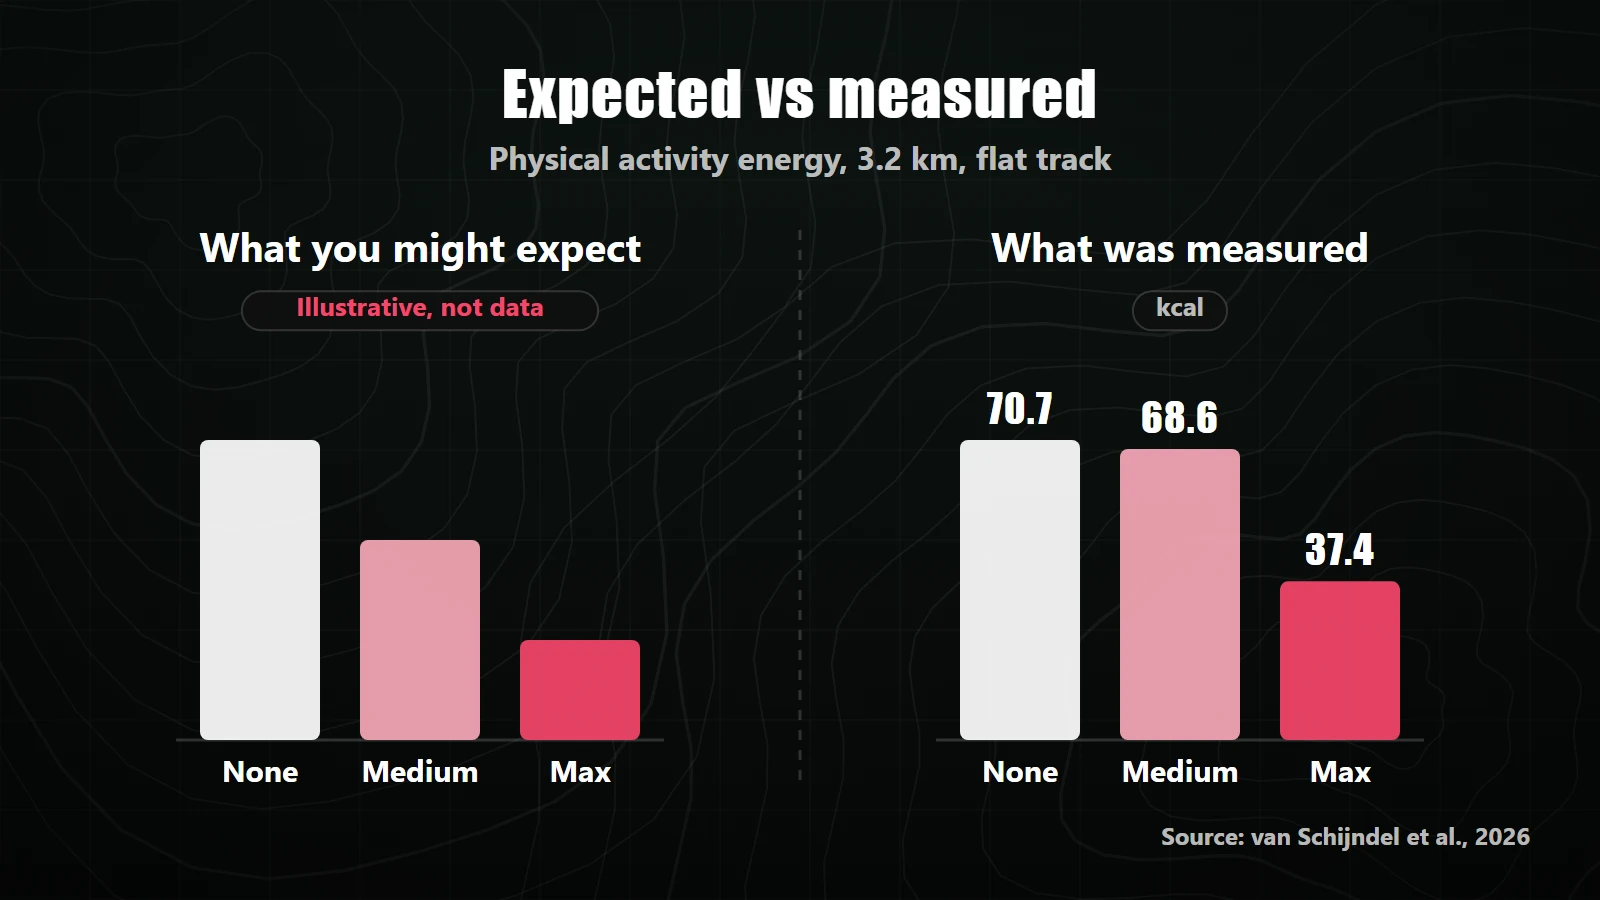
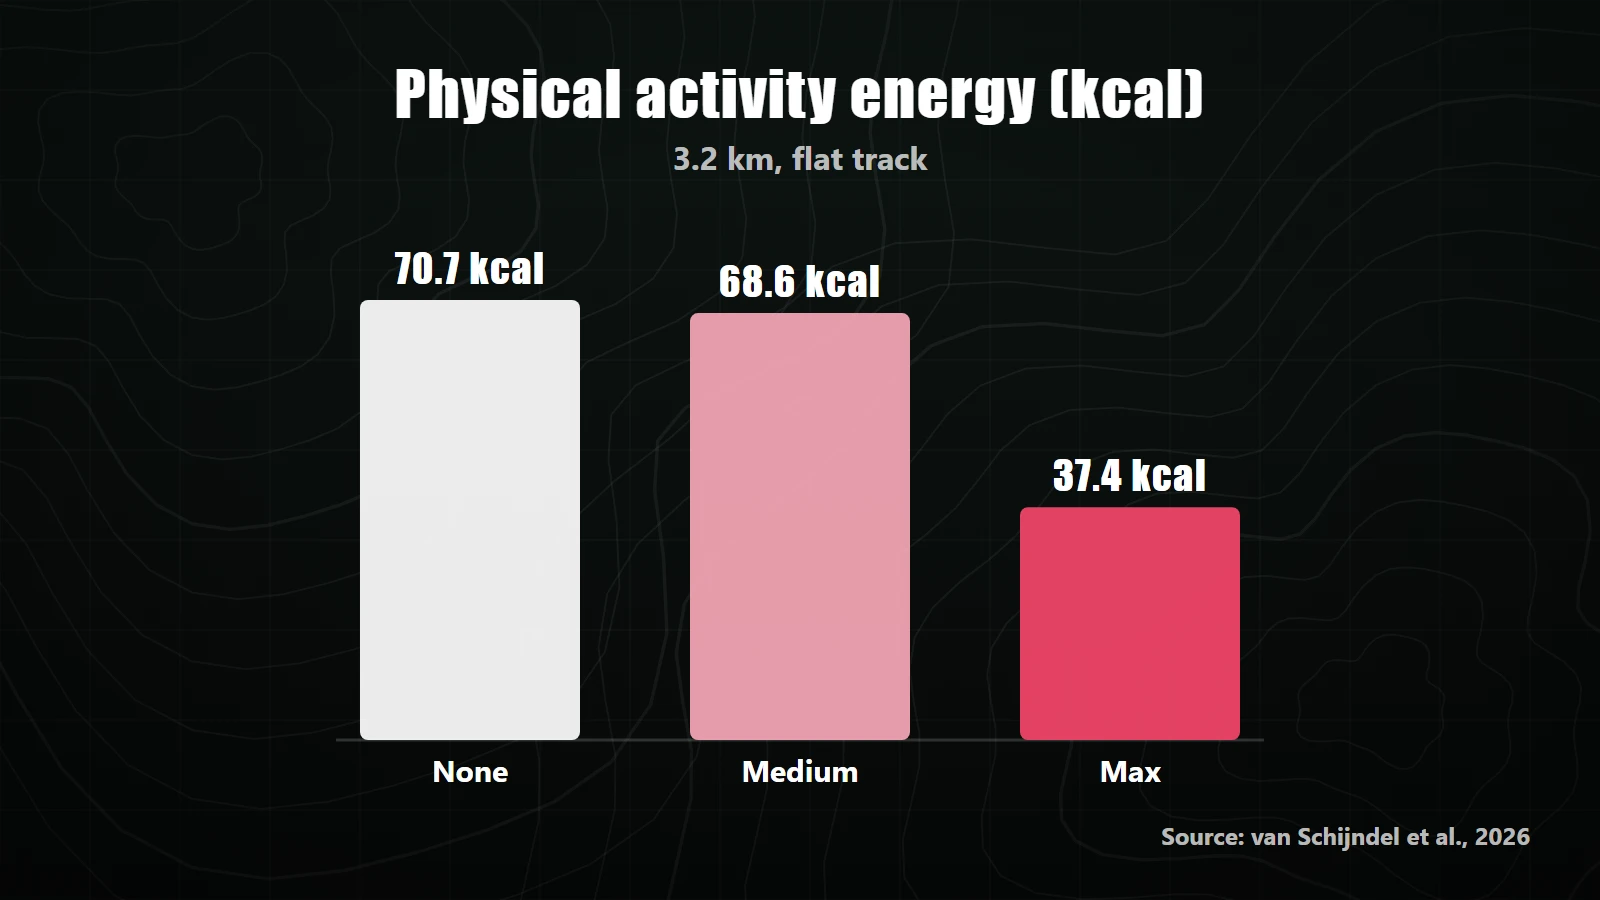
In this study, the dial did not behave like a dial. Activity energy came out at 70.7 kcal with no assist and 68.6 kcal with moderate assist, and the study found no significant difference between the two. Max assist dropped it to 37.4 kcal. That is 47 percent less. The authors note that some earlier studies found a step-down at each assist level and some didn’t, so this is one carefully measured result, not the last word.
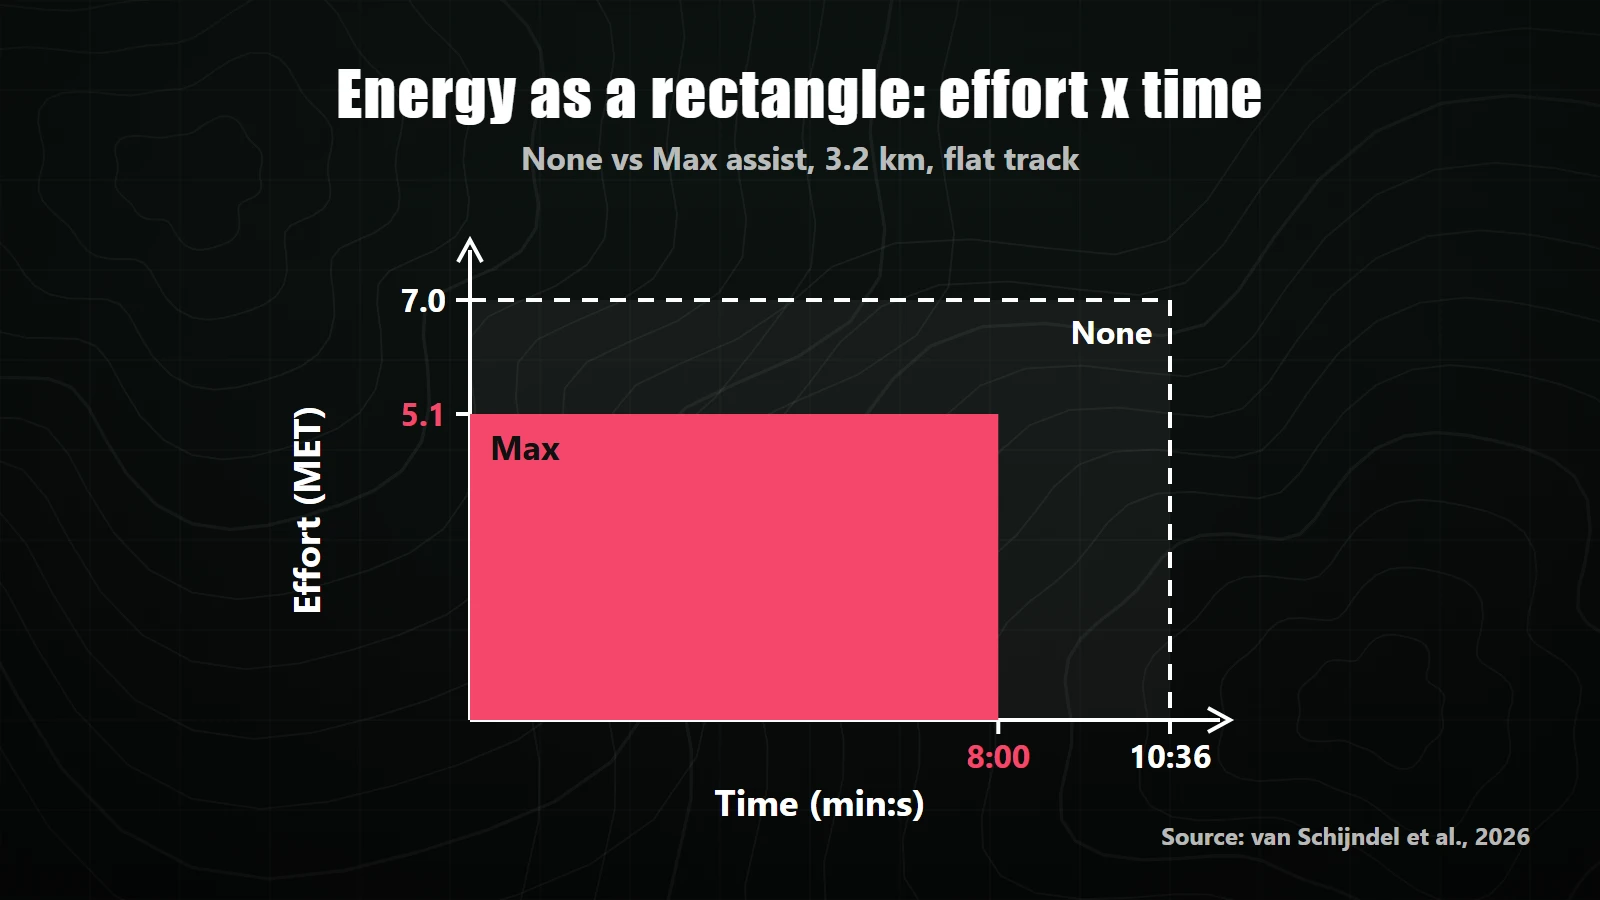
The exercise in a ride has two sides: how hard you work, and how long you work. Multiply them and you get the area.
Exercise scientists measure the first side in METs, short for metabolic equivalents. One MET is roughly what your body burns sitting still. Seven METs is seven times that.
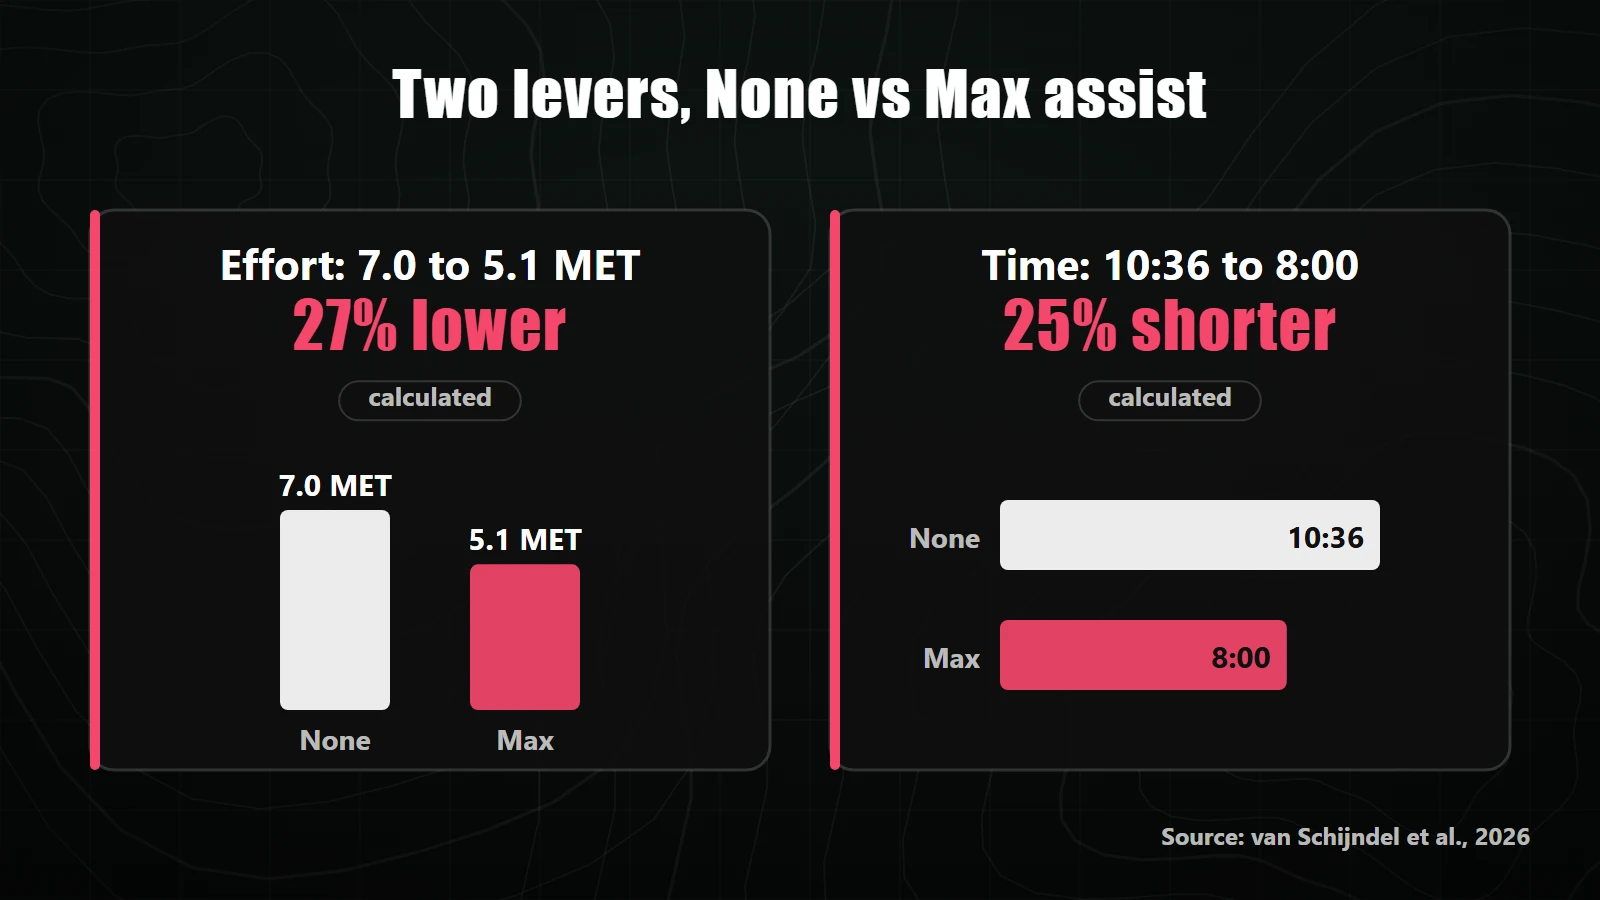
Max assist shrank both sides. Intensity fell from 7.0 METs to 5.1, about 27 percent lower (calculated: 5.1 ÷ 7.0). Time fell from 10 minutes 36 seconds to 8 minutes flat, about 25 percent shorter (calculated: 480 s ÷ 636 s). Neither cut is dramatic alone. Multiply them and the area drops to about 55 percent of where it started. The study reports that volume, METs times minutes, fell from 73.3 to 40.6, a 45 percent decline.
If you’re keeping score, you’ve now seen 47 percent and 45 percent, and the paper also reports 44. All three describe the same rides. Total energy, including what you’d burn sitting still, fell 44 percent (82.7 to 46.5 kcal). Activity energy, with resting burn subtracted, fell 47 percent. METs times minutes fell 45 percent. Different rulers, same rectangle. “Nearly half” is true on all three.
The authors offer an explanation. The test bike had a front-hub motor, and at the moderate setting its help cut out around 18 to 19 km/h. With no assist at all, riders already chose about that speed. They were already riding at about the speed where the help stopped, which left the motor little to do.
They also point out the track was flat, and they cite earlier research finding the biggest differences between assisted and unassisted riding on climbs.
The 2024 Adult Compendium of Physical Activities, the standard reference for MET values, only partly agrees. It lists an e-bike at 6.8 METs with no electronic support, 6.0 with light support, and 4.0 with high support. That puts light support about 12 percent below none (calculated: 6.0 ÷ 6.8) and high support about 41 percent below (calculated: 4.0 ÷ 6.8).
So the Compendium shows a gradual step at light support, the kind this study didn’t find. The two agree on the big drop at max assist and nothing finer. The Compendium’s “light” and the study’s “moderate,” setting 3 of 5 on one particular bike, aren’t necessarily the same thing either.
The Compendium also lists general mountain biking at 8.5 METs. That is a separate activity entry, not the same bike with the motor off, so it doesn’t belong in this comparison.
Heart rate tells a related story. A Brigham Young University study put 33 experienced mountain bikers on both a conventional mountain bike and an electric one. Average heart rate on the e-bike was 94 percent of the regular bike. That is heart rate, not calories, and no source I found says which assist level the riders used. Lower, but not by much.
The study used a flat track, a front-hub motor, and a fixed distance. A trail day usually has none of those three.
Climbs are where assist does the most work, according to the research the authors cite, so the gap between assist levels on a hilly route is likely bigger than on a track. The authors also suggest that mid-drive motors, which respond to how hard you press the pedals, may behave differently from the hub motor they tested. I haven’t found a study that measured calories across assist levels on a trail. That one is still open.
The time side of the rectangle depends on what you hold fixed. On a set route, the e-bike finishes sooner, and that shorter time is a large part of the savings. The authors put it this way: the lower energy cost holds unless riders make up for it with longer distances. If what’s fixed is the clock instead, say a two-hour rental, the e-bike doesn’t shorten anything. You just cover more ground. That last part is my reasoning, not a finding, but the rectangle doesn’t leave much room for another answer.
One more thing the study measured: even at max assist, riders averaged 5.1 METs. Moderate intensity is 3 to 6 METs. The motor took nearly half the work and still left a real workout.
Whether e-bikes are allowed on a given trail, and which classes, is decided by whoever manages that land: a national forest, a park service, a state park, a county, or a city. Check with that agency for the trail you plan to use.
The numbers in this post are group averages from specific tests on specific bikes. Your watch and your body will produce different ones.
The motor saves energy two ways: it makes the ride easier, and it makes it shorter. Rent it by the hour and only the easier part is left.
Checking it on your own ride
The post measures effort in heart rate and METs, and your watch will produce different numbers. These are the pieces that measure the rectangle: a strap for heart rate, and a watch to show it.
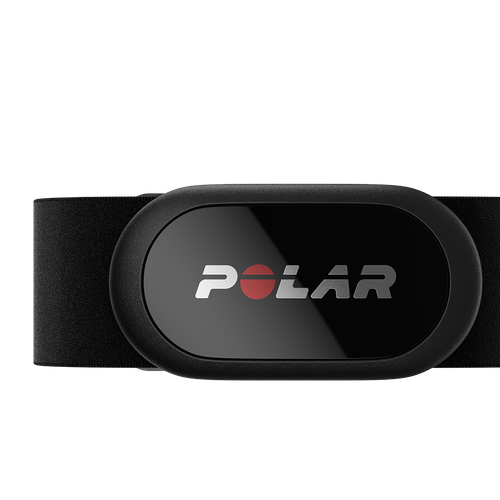
Bluetooth and ANT+ chest strap, so it pairs with most watches and bike computers.
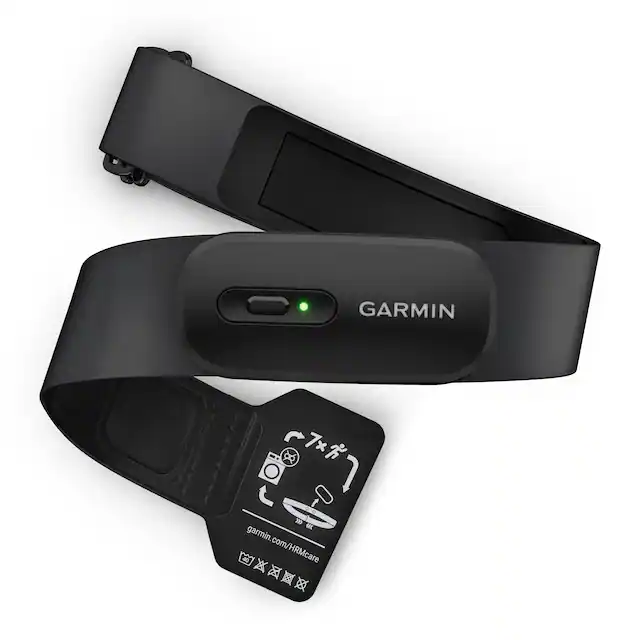
Garmin HRM 200 heart rate monitor
Chest strap with a washable band and a replaceable battery.
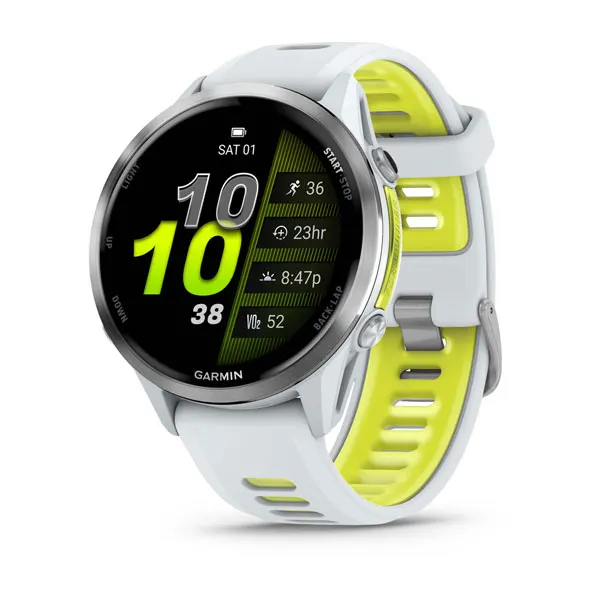
Garmin Forerunner 970 GPS watch
Shows heart rate, time, and distance on your wrist, and pairs with a chest strap over Bluetooth or ANT+.
Some links are affiliate links, meaning Ride Hike Roam may earn a commission at no extra cost to you.
Update note: Sources last checked October 31, 2026. The study results themselves won’t change, but newer research may add to them, and the Compendium is revised periodically. Recheck on the publish date.